Potential Meat Yield of Ostrich
By: Fiona Benson, Blue Mountain International
Introduction
Early in 1997 I set about understanding the Growth Curve of Ostrich
and began researching any data published on the subject. One of the
trials that I followed with interest was The Blue Mountain Bench Mark
Field Trials. One fact I found most interesting was that the results
were published on a monthly basis and I sensed the clear confidence of
the knowledge of the outcome of those trials, as it was clear that this
was simply documenting what was happening on farms on a regular basis
at the time. It has to be remembered that this in an environment when
most were asking questions on how to keep birds alive, let alone
predict performance.
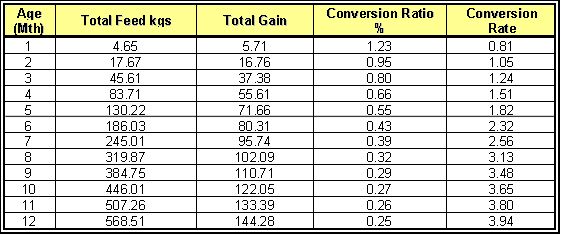
The average liveweight at 12months of the birds in the trial was 144kgs
at a feed conversion rate of 3.94:1. (Table 1) Birds slaughtered
yielded in excess of 50kgs of boneless meat.
Five years after the results of that trial were published, rather than
moving forward, there remains discussion throughout the industry on the
ability of Ostrich to produce meat yields double the average yields
today and the economics to raise such birds.
The aim of this paper is to prove why high meat yielding birds are very achievable and the commercial benefits.
Table 1: Blue Mountain Weight Gain Trial 1996-1997

Investigation
It was clear that such results deserved further investigation into
learning the detail that lay behind these results. Three groups of
birds were tracked with monthly weights using electronic digital scale.
Feed consumption and cost was recorded and calculated at the end of
test.
All chicks were started on Blue Mountain 20% Chick Starter Crumble
for the first 6 weeks. Then, Blue Mountain 20% Grower pellets were
gradually mixed with the starter crumbles changing the chicks to the
Grower pellet completely by 8 weeks of age. At the age of 3-4 months,
chicks were gradually introduced to the Blue Mountain 32% Feedlot
Supplement that is mixed according to Blue Mountain recommendations for
the Grower diet. The recommended ingredients to be mixed with the 32%
Feedlot Supplement are 17% CP Alfalfa pellets and whole yellow Corn. By
month 5, the chicks diet is 50% Blue Mountain Grower pellet and 50%
Blue Mountain Feedlot Supplement mix.
GROUP ONE:
This was a small group of birds with superior genetic potential for
slaughter birds. They were Blues and were hatched 02/06/96. Average
liveweight at 12 months: 147.91kgs
GROUP TWO:
This group was average Blues with a mix of males and females. They were
hatched 04/07/96. Average liveweight at 12 months: 141.10kgs
GROUP THREE:
This group is average Blues with a mix of males and females. They were
hatched 22/07/96. Average liveweight at 12 months: 147.00kgs
Each group was weighed on a monthly basis. At the time of the trial
many people in the industry were referencing poor growth rates in the
winter months. So it was with great interest to note that the trial
details referenced the test weight period from 20/12/96 through
30/01/97 including extreme cold weather at the ranch. Out of the 42
days in this period, only 10 days were above 25 degrees F (-10C)
according to the ranchers record. Weather extremes reached a maximum of
-50 degrees below zero F (-45C). The test weight period from 30/01/97
through 04/03/97 reported extreme cold weather at the ranch with a
considerable amount of snow with lots of ice on the ground.
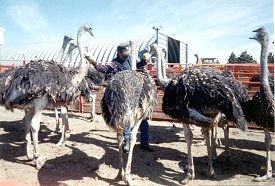
Figure 1: Test Chicks
I
contacted the farmer to learn more. He told me “everyone was stating
that their birds are not growing in the winter, but I knew my birds
were growing well and I set out to prove this”. Throughout the trial no
leg problems or feed consumption problems were reported in any of the
groups. One chick was reported lost from group 2 at one month of age as
a result of a cat chasing the chicks and this led to the chick’s neck
breaking from being trampled. During a farm visit several years later
the farmer informed us that he believed the birds to be growing better
in the winter months than the hot summer months. Also during that visit
he produced his most recent cutting sheet from the abattoir…all the
meat yields were in excess of 110lbs (50kgs).
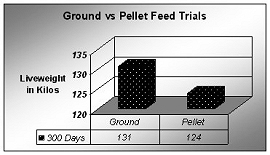
Figure 2: Ground Feed vs Pelleted Feed Trial
Around
the same time there was a further Blue Mountain trial underway. This
was to compare chicks raised on pelleted feed and ground feed as there
was considerable discussion on this subject. Pelleted feed being very
much easier but carrying very much higher feed costs compared to
milling and mixing on farm. The results of this feed trial were also
most impressive. The birds were reported to be fed exactly the same
ration…one being pelleted and the other ground and mixed on farm. The
birds were weighed at 300 days (10 months).
The birds on the ground feed weighed 131kgs (288lbs) and those on the
pelleted feed weighed 124kgs. (273lbs) Figure 2. Again very impressive
results compared to the liveweight of 95kgs that was generally being
advocated throughout the industry as the ideal slaughter weight. Above
all, this liveweight of 95kgs was being advocated to be achieved with a
14 month slaughter age.
Further sources of growth rates that I was able to find were presented
in different papers at the World Congress in 1996 and will discuss
later. Another source had insufficient information to be able to work
with the figures, though they showed 95kgs (210lbs) at 9mths and 100kgs
(220lbs) at 12mths.
The most interesting growth rate information were those published by
scientists at Stellenbosch University. Two Gompertz models were
constructed, one in 1991 [1] and one in 1995 [2]. It is reported that
the Gompertz has multiple uses in production and research. That it can
be used as a tool to measure the standard of management and feeding
compared to the potential growth of ostriches. [3] It was also reported
that the potential growth under conditions of no restraint of an
ostrich is depicted in the Gompertz models as opposed to actual growth
results. It was argued that under practical conditions such results may
not be achievable [4] and the reason given for the new, lower model, to
be constructed.
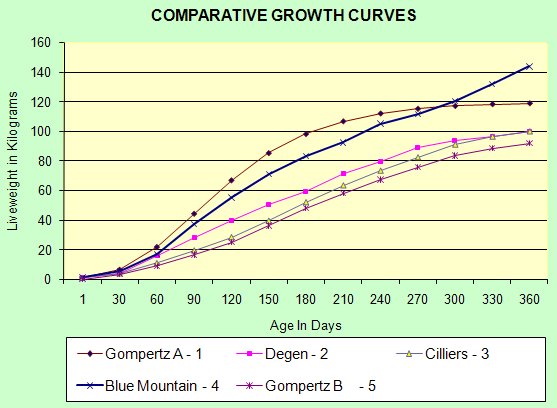
Figure 3: Comparative Growth Curves [5] [6] [7] [8] [9]
Analyses of Results
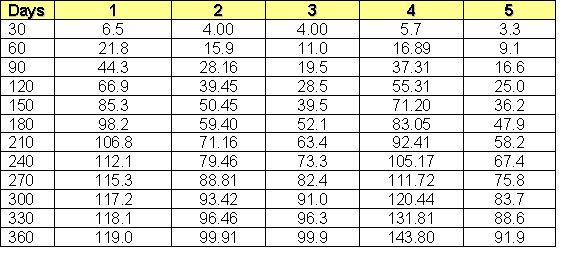
The first fact that caught my eye after plotting the different growth
curves was the performance of the Blue Mountain Field Trial birds
[8]…they not only ran close to the First Gompertz model to be
constructed, they broke right through it at an age we are being told
the growth normally flattens. When analysing the trial data one finds
the trials took place on a commercial farm and in extremely cold
weather conditions…making the statements regarding the Gompertz A model
as assuming only achievable under conditions of no restraint [4]
somewhat meaningless! Further investigation confirmed that these
results were being replicated on a daily basis over a number of years
on this and other farms dedicated to paying attention to high standards
of feed management and farm management.
Table 2: Comparative Liveweight in Kilograms as per Figure 3
Any
one with a knowledge of production livestock understands that
significant improvements in performance of other specie have been made
over the past ½ century as a result of a combination of technological
developments in nutrition combined with genetic improvement programs.
These results were being achieved before any significant genetic
improvement programs have been implemented. With an industry only a few
years old in the US as was the fact at that time, these birds could not
have been more than one or two generations of a genetic improvement
program, if that. With an industry that was searching for answers,
these results were extremely exciting to me.
The next best performance was the data published by Degan et al
in 1991 [6], with considerably lower weight gains. With publication of
the figures it was referenced that these results were achieved working
with Turkey Starter and Turkey Grower Diets. We all know that Turkey
producers would not use Chicken Starter and Chicken Grower diets to
achieve performance…so that is a clear indication that there must be
significantly improved performance possible working with rations
specifically designed for Ostrich, confirmed by the BM Field Trials and
other farmers following the program.
The final two curves are reported as theoretical, one created as part
of a Ph.D. thesis [7] and the Gompertz B Model [9] presented at the
1998 Scientific Conference but are very typical of current general
performance today. Most all references to rations achieving these
levels from all sources discuss energy levels or protein levels or
fibre levels. There are discussions on non-productive type of
ingredients. There are rarely, if ever, discussions referencing the
interrelationships between all the ingredients. There are rarely (if
ever) discussions relating to the vitamin and/or minerals in the trial
rations. Yet, it is published rations relating to these type of growth
curves which are reproduced by animal feed companies and will have
carried out no research on ostrich whatsover. Farmers believe they are
achieving the correct results as the industry itself is working to such
low target figures.
Of course, using liveweight as the only guide is not sufficient as that
liveweight may be carrying a great deal of fat. In 2000 the
International Ostrich Association produced a meat chart. The chart also
provided average muscle weights. When these are compared alongside
studies carried out in the United States and compared to the Blue
Mountain Ostrich Meats cutting charts…one can see very significant
differences.
Table 3: Comparative Muscle Weights
(1 = Average South African Muscle Weights) (2 = Texas A&M Research) ( 3 = Average From BM Cutting Sheets)

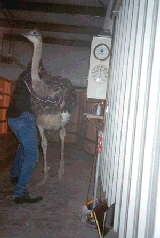
Figure 4: Young Test Bird
at Weighing. Note the tremendous
height and width of the chick.
Discussion
Frequently the comment is made "we don’t believe the figures" when
discussing the "production goals" that Blue Mountain set. When studying
the detail behind most rations currently fed as discussed above, it is
very easy to understand the untapped potential of Ostrich when all
things are right. The Gompertz A model can be considered as a very
reasonable target to aim to achieve. From all I have learnt, it is my
guess that any farmer commencing a full production program today, 10
years from now will be exceeding those targets as herd averages.
It only makes sense that if birds fed rations designed for Turkey can
perform better than the targets set in the Gompertz B model, then it is
clear that when fed balanced rations designed for Ostrich they can only
do better, provided that person designing the rations understands
Ostrich and the farmer or mill mixes that feed correctly and the
highest standards of feed management are practiced. When birds are
producing as well as the Gompertz A model and continuing putting on
muscle at a time most consider the curve normally flattens…this was a
further clue to me that there was considerable knowledge and
understanding of Ostrich behind the design of those Blue Mountain
rations.
My
investigations then took me onto slaughter lines, and there it is very
clear to see birds demonstrating many symptoms of nutritional
deficiencies…such as livers demonstrating a range of disorders, poorly
developed hearts, minimal muscle development and in some cases muscle
deterioration, white muscle disease and so on. Deficiencies have to be
severe for them to be visible. Modern nutritional thinking has moved
beyond seeing nutritional adequacy as simply freedom from symptoms if
farmers are to make good returns. [10] It is clear that if birds
presently demonstrate symptoms of nutritional deficiencies, it must be
possible to considerably improve growth rates and feed conversion in
the future if the nutritional deficiencies are corrected.
Chick mortality is another area that provides clear proof that faster
growth rates and feed conversion are very achievable. When autopsying
chicks one sees a significant variation in internal organ development
and yolk sac conditions. [11] [12] This is further evidence that when
these are eliminated significant improvements in growth rates and feed
conversion must be very achievable and I have proven this to myself.
Over the years I have seen many different rations that are reported to
be for Ostrich. Most all are based on poultry style rations, contain
non-productive feed ingredients and fall well below the nutrient values
of the rations reported in the BM Field Trials. Many rations also
contain premixes designed for poultry or beef cattle. Others are copies
of different published data, sometimes with serious errors in the
copying of that data, other times with no understanding of the detail
behind the published data. Further evidence to me of the untapped
potential as no professional livestock producer would consider feeding
rations based on premixes designed for another specie or try to copy
data without knowing the parameters behind that data.
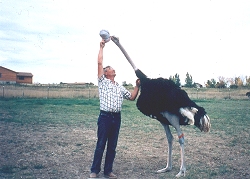
Figure 5: Daryl Holle and Barney (16mths)
It
is clear that some birds are genetically more capable of achieving
higher meat yields than others as genetics obviously play an important
role. When my own African Blacks have been viewed, the comment has been
“oh, but you must have better genetics” when in fact nothing could be
further from the truth. The first Blues and Reds that I ever saw I
found smaller than my African Blacks in South Africa, before I started
to work with the BM rations. Thus further proving the potential when
nutritional deficiencies are removed from ostrich production and
genetic improvement programs implemented.
Figure 5 is a 16mth old bird that was purchased in 1990 as a scrawny 3
month chick as part of a batch of first test birds. Daryl Holle is a
large-framed man, who is 6 feet, 3 inches in height (190 cm) so one can
see how large this test bird actually was. It was the results that
Daryl was achieving with these trial birds, and farmers witnessing the
tremendous growth that resulted in the birth of Blue Mountain Feeds.
Conclusion
What has astounded me during my investigations is the perceived
“assumption” that many of these clear symptoms of deficiencies are
taken as “normal”. Even today, with all the clear evidence that certain
things may be “usual” as they are seen so often, but most certainly are
not “normal”, there continues to be a debate on some issues that are
basic common sense in livestock production.
The other approach was that from a nutritional point of view I found
that Daryl Holle looks at the symptoms…be it leg deformities, poor egg
quality, low fertility, liver problems or whatever…he then will
identify the cause/deficiency of those symptoms and the effect. The
causes and/or deficiencies being the same in most all species…just
different methods to fix those deficiencies as each specie has its
unique requirements and tolerances. From there he determines what is
required to correct that problem. It is then important to understand
how the remedy affects everything else to avoid new problems arising.
I also found that Daryl Holle went a great deal further in that he was
discussing “production” goals and “performance” characteristics in the
design of rations and not simply keeping birds alive and/or free of
deficiency symptoms.
All the above, combined with my personal experiences, proves beyond any doubt the untapped production potential of ostrich.
References:
[1] Du Preez et al Stellenbosch University 1992
[2] Cilliers et al Stellenbosch University 1995
[3] Feeding and Feed Management, W.A. Smith and J.Sales, Stellenbosch
University, Practical Guide for Ostrich Management and Ostrich Products
Page 11 1995
[4] Nutrition of the Ostrich for Meat and Leather, J.P. Hayes, S.C.
Cilliers, and J.J. Du Preez European Ostrich Association World
Congress, 1996
[5] Gompertz 1 - Gompertz Model, Nutrition of the Ostrich for Meat and
Leather, J.P. Hayes, S.C. Cilliers, and J.J. Du Preez European Ostrich
Association World Congress, 1996
[6] Degan 2 - Degan et all Animal Production. 52,225-232
1991 Referenced B.D.H.van Niekerk and U T Muller, Maximising Growth of
the Ostrich for Slaughter, European Ostrich Association World Congress,
1996
[7] Cilliers 3 - S.C. Cilliers, University of Stellenbosch, Ph.D.
Thesis 1995. Referenced B.D.H.van Niekerk and U T Muller, Maximising
Growth of the Ostrich for Slaughter, European Ostrich Association World
Congress, 1996
[8] Blue Mountain 4 - Blue Mountain Farm Benchmark Trial, Carried out
by Darrell Wagoner, Oakridge Ostrich Farm, Hayes, Kansas, USA.
1996-1997
[9] Gompertz 5 - F.C. Cilliers Determination of Metabolisable Energy
and Amino Acid Requirements for Maintenance and Growth of Ostriches,
Ratite Scientific Conference, 1998
[10] Optimum Vitamin Nutrition for Optimum Health and Performance in Nutrafacts - Vol.3 No.2 1999
[11] D.G. Holle – Yellow Livers on Baby Chicks are not Normal
[12] F.V. Benson, D.G. Holle – Nutrition and Health, Curso
Especializado en Producción de Avestruces nutrición – manejo y
patología, UST, Santiago, Chile 2001
Copyright© of Blue Mountain all rights reserved