Authors: Fiona Benson, Blue Mountain International;
Daryl Holle, Blue Mountain Feeds, Inc.
The
processing of Ostrich is developing in many countries. Very often,
producers themselves are joining together to set up a processing
operation to assist their fellow producers in the marketing of the
birds. There is one common complaint heard continuously from processors
in all countries, including South Africa, and that is the tremendous
“variability” in carcass and individual muscle weights. When studying
the economics of this problem, all by itself, it is clear to see why
the success of the industry is put in jeopardy for everyone. There is
also tremendous difficulty with what the consumer/customer is expecting
in muscle weights when purchasing whole muscles from a processor. This
is because of some very poor muscle weight guideline data being
publicized in the industry. Until Producers and Processors address this
situation on common ground, it is most difficult to produce and market
Ostrich in an economically viable manner. Why is this?
There are several underlying industry factors contributing to the economic processing of Ostrich in a viable manner:
The
industry is trying to move from a skin driven ‘controlled supply’
market to a ‘market driven’ professional livestock production industry,
which includes the marketing of high quality meat muscles that
consumers desire. The majority of knowledgeable people report they
recognise it requires birds yielding greater than 40kgs meat for the
industry to be commercially viable for producers, processors and the
industry itself. However, others are continuing to attempt to retain a
skin driven ‘controlled supply’ situation, based on raising and
processing birds with poor quality meat using outdated livestock
farming methods. It is the belief of these few that this will preserve
the market value of the skins and the only way to produce ostrich
commercially, which is a backward direction for a viable Ostrich
industry.
It is this conflict that is currently stifling forward progress by
providing producers, the people raising the ostrich, with conflicting
advice which is presenting meat processors with some tremendous
difficulties and is also confusing our meat consumers/customers at the
same time.
Large Variance in Carcass/Muscle Weights – Processing Difficulties:
Processors have orders to fill and plan their production on knowledge
of the number of birds they have booked for slaughter or can handle in
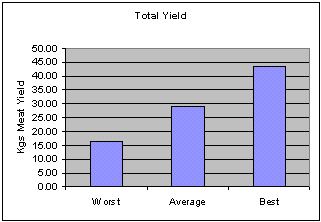
a day. The range of carcasses, total meat yields and individual muscle
weights, varies from the worst case scenario of a batch of slaughter
birds AVERAGING 16kgs (35 lbs) of total meat to in excess of 50kgs (110
lbs) of meat from birds 12 months of age. This is a range of 34kgs/bird
(75 lbs) …more than 300% variation in meat yields from low yield to
high yield birds.
We have seen cutting sheets from high yielding birds where all in a
batch yielded in excess of 50kgs (110 lbs) of boneless meat from
slaughter birds 12 months of age. It would take more than 3 birds of
the worst case example of low yielding birds (16kgs) to supply the SAME
weight of meat from these type of high yielding meat birds. This high
variance results in a terrible problem for the processor who is trying
to produce an economically viable product.
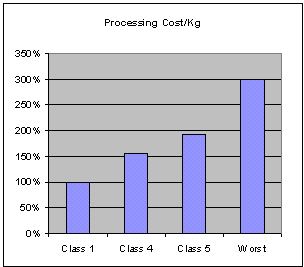
As can be seen from these extreme yield variances, economics and
planning are impossible and the processing costs of processing 3 times
more of these smaller birds is totally unfeasible.
The processing costs will be very similar per bird…but as can be seen in Figure 2, there can be as much as 300% variation in the costs per kilogram to process those birds as a result of the variations in meat yield. This clearly indicates the reasons why processors cannot fairly afford to pay by bird or carcass. When paying by boneless meat yield, it has to be on a “graded meat quality” basis connected with a “total meat yield” to encourage the good birds and eliminate the birds that are uneconomic for the producer to raise and the processor to process. This will also ensure progress toward high quality meat that is most desirable to our consumer/customers so they will come back for more.
Figure 2 - Processing Costs
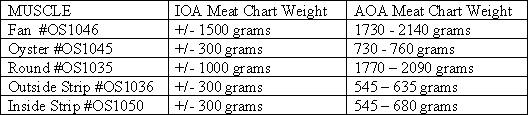
Industry Meat Charts stating contradictory information:
In
2000, the International Ostrich Association (IOA) produced a Meat Chart
to assist in standardising muscle identification and also provided
average muscle weights for guidance. Previous to the introduction of
this IOA Meat Chart, the American Ostrich Assn in the U.S. (AOA) also
created its own AOA Meat Chart that included muscle identifications and
muscle weight ranges. Table 1 references the differences of a few
example muscles between these two associations. It is no wonder there
is terrible confusion in the Ostrich industry. It all depends on the
chart being used in a certain country as to what the consumer/customer
is expecting and demanding.
Table 1
This
is causing significant difficulty for the processors as customers
reading these meat charts have come to expect muscles of these weights
(depending on the meat chart being used)…and therefore it reflects very
poorly on the processor when these weights are highly variable. As can
be seen the muscles weights in the Figures 3 and 4 were more than
double in most cases between the worst and best. Therefore providing
averages on the chart in this way is highlighting the variations and
creating further difficulties.
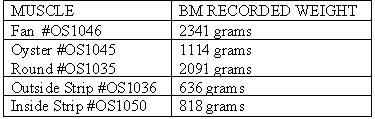
To confirm the fact that the IOA Meat Chart is misleading customers and
the industry, Blue Mountain has slaughter record data from the U.S.
from large batches of birds fed correct diets and producing the highest
quality meat possible using the Blue Mountain “New Ostrich Industry”
concept of cost effective meat production. The Blue Mountain data shows
yet a different story to the IOA Meat Chart. Table 2 clearly shows that
birds fed a correct diet will FAR surpass the individual muscle weights
indicated in IOA International Meat Chart. The birds used in this data
were not “superior genetic” birds, but rather average birds raised by
several different producers and all birds on a good nutritional diet.
It is also important to note the Table 2 muscle weights was Ostrich
Meat that ALL graded as PRIME ostrich meat grade with bright red meat
of even colour with the highest degree of tenderness which is what our
consumer/customer demands.
Table 2
Table
2 also tends to confirm that data used to determine average individual
muscle weights on the IOA International Meat Chart shown in Table 1 HAD
to be derived from either very poorly fed birds or severely deficient
genetic difficulties. But, Blue Mountain has enough meat weight
information data to ascertain that it is clearly a representation of
some very poorly fed birds rather than only genetics. In our opinion,
the individual muscle weights shown in the IOA International meat chart
are muscle weights that again clearly identify a bird that is not
economically viable for the producer to raise or for the processor to
economically process for a viable industry.
Because this type of incorrect data (very small muscle weights from
poorly fed birds) is being published on some meat charts around the
world, the customer/consumer is expecting something that is not
economically viable or proper for the Ostrich industry to produce or
process. A “giant” industry mistake!
Examples of Extreme Variations of Muscle Weights:
Swartland Abattoir in South Africa, have provided a couple of practical examples as this is such a major problem to them:
1. They have a large supermarket customer in Europe that take
the Oyster Filet (OS1045) as a minimum 200gram steak, presented in
individual trays. In one batch of 92 birds NOT ONE of the oysters
achieved the required minimum weight of 200grams. They were ALL too
small. The order was lost as they could not supply. In this example,
the birds were even MORE nutrient deficient in their diets and could
not even begin to meet the very low minimum of the IOA meat chart, let
alone have a chance at being decent quality meat with average weight
muscles.
Figure 3 - Comparative Weights Individual Filet Muscles
Muscle names as per US Meat Chart
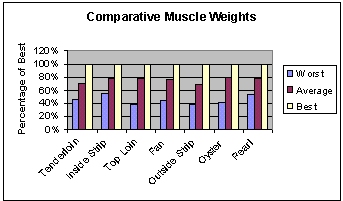
2. Take this further…the customer in this example is looking for a minimum 200gram steak. The lowest weight of the Oyster filet used in Figure 3 was 275grams and the heaviest 680grams. We have seen batch sheets with averages for the Oyster filet at 1000grams and more harvested from properly fed birds. That would provide 5 by 200gram Steaks for this customer from ONE bird. As can be seen most clearly, it is extremely difficult to plan production and supply with such variability in bird size, muscle weight and size, and meat quality differences in the birds because of diet fed.
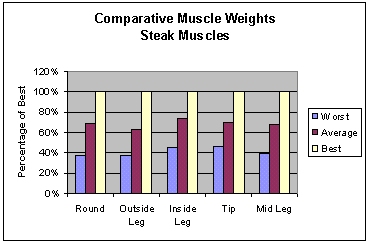
3. Another customer takes the Round (OS1035) cut through the middle to enable removal of the sinew that runs through this muscle. This customer expects (because of his knowledge of the IOA Meat Chart with low muscle weights) that each half will weigh a minimum 500grams; anything smaller this customer is not interested in as it is not useable for his needs. The larger the muscles, the happier he is. All too often Swartland reported that OS1035 fails to meet this weight resulting in a dissatisfied customer. This again indicates that producers are raising some very poor birds raised on very poor nutritional diets. This matter is destroying the very industry we are trying to progress.
4. It is worth noting that the smallest Round (OS1035) in Figure 4 was 1.6kgs and the best 2.2kgs...the best more than DOUBLE the size stated for this muscle on the IOA meat chart.
Figure 4: Comparative Weights Individual Steak Muscles
Muscle names as per US Meat Chart
When
a slaughter plant cannot supply, this is not only loss of revenue but
also puts the credibility of the slaughter plant (and our industry) in
question. Slaughter plants everywhere are currently facing these types
of problems. This variability from batch to batch is IMPOSSIBLE for
them to work with. This is one of the most important factors that has
resulted in the failure ofso many processing operations or making it
most difficult for others to operate efficiently. It is also one of the
reasons that so much emphasis continues to be placed on the need for
high revenue from the skins, which takes our industry backwards.
Variations in Meat Quality:
OS1060 – for those without a meat chart handy, this is the muscle that
goes part inside and part outside the carcass. In Figure 3 it is the
Tenderloin (US Meat Chart). In a quality meat bird this muscle is
perfectly even right through and one of the best muscles on the birds.
Some processors have NEVER seen this. With correctly fed birds it is
impossible to tell one end from the other in tenderness, the muscle
fibre "grain" all runs in the same direction when cut cross grain as it
should be…all cuts are exactly the same. In a poorly fed bird the one
end is course grained and can hardly be cut with a knife. The IOA
International Meat Chart shows this muscle as split to Filet quality
and Steak Quality. This is an immediate loss of revenue, as a high
value muscle becomes a lower value muscle. It is also a poor reflection
on our industry that there has been seen to be the need to
differentiate this muscle in such away as those designing this chart
had clearly never been presented with well produced Ostrich. What are
the financial cost implications?
The actual weight differences for muscle number OS1060, called the
tenderloin and referenced in Figures 3, shows the "worst" weight with a
low of 815 grams and the "best" weight shows a high of 1760 grams. When
reading the IOA meat chart, it shows 500 grams total weight, split into
two different classifications – OS1060F (filet) and OS1060S (steak).
These low yielding birds can only achieve 50% at the premium price for
OS1060, as it has to be divided. One does not need to be a
mathematician to understand the financial implications of this are most
significant.
One European processor has informed me they find "filet" quality
muscles so poor in some birds that they market them as "steak" quality,
not wishing to risk their reputation selling them as "filet" quality.
Conversely with the better quality birds they are marketing "Steak"
muscles as "Filet" quality as they are of excellent quality by
comparison. Very difficult to "plan" production for customer orders not
knowing if one can supply specific customer needs in this situation.
Another factor very noticeable when visiting processing plants is the
amount of light coloured meat that has to be trimmed from a high value
“filet” muscle. This has two cost implications: The loss of revenue
because of the loss of weight of high value cuts plus the additional
processing time required to trim these muscles.
Finally, poor muscle development and muscle degeneration, caused by
extremely poor bird diets, results in tremendous variations of meat
colour from batch to batch and also effects meat taste and texture. In
birds fed PROPER diets, the individual muscles and muscle groups may
show slight variable colour before separation, but once separated, the
antioxidants in the meat take over and all become the same bright red
colour.
Variations in Revenue per Bird:
In regards to the comment:
“Nutritionists are telling farmers they can have birds at
slaughter weight by 9 months but the skins are not sufficiently mature
at this age to have a quality skin.”
This comment is stated all too often and made by those with NO
knowledge of livestock nutrition. So why do they continue to make these
statements?
 |
 |
|
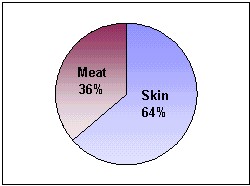
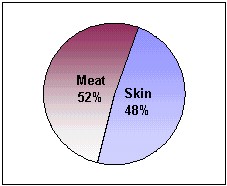
| Figure 5: SA Generic Bird 2001 | Figure 6: SA Meat Bird 2001 |
|
 |
 |
|
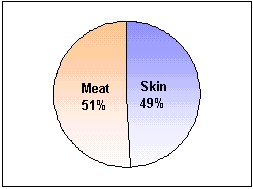
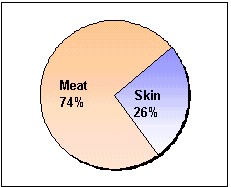
| Figure 7: Canada Generic Bird 2001 | Figure 8: Canada Meat Bird 2001 |
People
making these statements have NEVER had the opportunity to see skins
from PROPERLY fed birds for comparative purposes. It has also been
assumed by these same people that 95kgs is the correct live weight of a
bird at slaughter…yet a larger bird, properly fed, will produce greater
usable skins and much higher yields of quality meat…something that will
provide manufacturers and processors with a more commercially viable
product.
It has been argued to producers that the meat revenue from a bird is
only 25% of total bird revenue…of course it will be if the birds are
demonstrating so many signs of malnutrition and producing so little
muscle development. The economics change significantly once a bird is
producing double current low meat yields…even if slaughter is delayed
till 12 months rather than 9 months of age. Some nutritionists tell
farmers that only fat is produced on birds fed more than 9mths—This is
simply not true and a statement of ignorance. A correctly fed bird will
continue to put on muscle cost effectively until 12 – 14mths, though it
is probably questionable if later slaughter optimises the profits for
the farmers because of the lower feed conversion factors in the later
months.
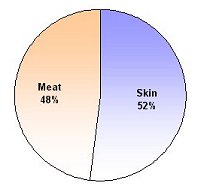
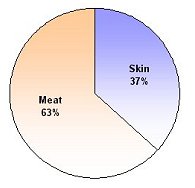
Figures 5 and 6 2001 assume current average meat prices (gross of
slaughter fees) paid by South African abattoirs and an average
R1000/skin (US$125). It could be questioned how many farmers, not
marketing their own skins, actually achieve this AVERAGE for all their
slaughter birds. Many farmers do not see any feather revenue as they
don’t harvest them to eliminate bird stress or see any direct benefit
from the processor, so feathers are not included for this exercise. As
can be seen in Figures 5 and 6, even the lightweight birds shows the
meat revenue is 36% (Figure 5) of the total revenue of that bird for
the farmer and this meat revenue increases to 52% on a quality meat
bird (Figure 6).
Figures 7 and 8 are based on US$105/skin for both (lower skin revenue),
though I am told that the low weight slaughter birds produce skins that
generally achieve discounted payments much lower than that price, as
they do not achieve acceptable quality. One can easily see how GREAT
and important the meat revenue itself can be to the overall TOTAL
revenue of the bird (meat and skin revenue) even when skin prices are
lower. The past 12 months have seen significant changes in the Rand
Value of the meat revenue and an easing of skin prices. This has
changed significantly the percentage value of the meat revenue, even
from a non-meat bird…see Figures 9 and 10.
As
a side note, it is also important to know that the overall TOTAL
revenue per bird (skin and meat) was 10% better in Figure 7, when
compared to Figure 5, despite the lower skin price in Figure 7 on the
standard birds. Also, the overall TOTAL revenue per bird (skin and
meat) was nearly 60% better in Figure 8, when compared to Figure 6,
despite the lower skin price in Figure 8 on the meat birds. What this
proves is that the MEAT REVENUE is most important to overall total
revenue of the bird especially when times are depressed on skin prices.
Trying to “CONTROL” skin prices is NOT the answer to a “viable” Ostrich
industry. The answer IS to produce a quality bird that will yield
quality meat and quality skins with high yields and extremely good
consumer acceptance. That will maintain good consumer demand for all of
our Ostrich products and will in itself develop a “viable” Ostrich
industry.
So, where do we go from here as an industry to straighten out and correct this mess in order to progress to a viable industry?
Achieving Quality Meat Birds:
The above illustrations demonstrate just how necessary it is for the
processors to be presented with more consistent birds of good quality.
Achieving this will take time with the first step recognising the
problem, understanding the causes, and then putting in place programs
to address the situations that are causing the difficulties.
The correct nutritional program of the slaughter birds is essential to
achieve good meat production. There has been little published data
presented in the past and the data that has been published was based on
feed rations that were designed to ‘hold’ birds rather than optimise
the ostrich’s outstanding ability to convert feed to muscle. Leading
nutritionists have been quoted as stating: “Feed formulas must be
produced to prevent any fat on the birds" and "Abdominal FAT is of no
use to the bird whatsoever and a waste of feed dollars". A certain
amount of fat production is always essential for good health and good
muscle development in any livestock meat production industry. Currently
most Ostrich nutritional programs are not designed for good meat
production or good muscle growth. They were developed as a ‘holding’
exercise to keep a bird ‘alive’ until it reached the “perceived
optimum” slaughter age of 14mths with a liveweight of no more than
95kgs, which was only to satisfy the feather and skin market. The
thought of ONLY marketing skins and feathers from Ostrich and to
consider the meat as a small revenue “by-product” is short sighted and
is the thought process that will produce a bird that is not
economically viable. QUALITY meat from an Ostrich is a significant part
of its total revenue and immediate steps must be taken to progress the
industry towards that line of thinking so the Ostrich CAN be
economically viable to produce and process.
With breeders changing hands many times over the past decade and often
seeing two or three continents, there has been no genetic tracking or
development program put in place. For the most part the South African
industry has breeders in colonies (more than one breeding group in a
single pen), thus making it impossible to monitor genetic traits. The
genetics of the birds vary with some genetics better able to produce
quality meat birds than others.
Conclusion:
Raising a quality meat bird for the processor and customer requires a
program of “production” nutrition accompanied by good feed management
based on “production” standards, a farm management program that
includes an adequate recording system and then to implement a genetic
improvement program. This is how a “production” livestock industry
succeeds and crosses over into the “economically viable arena”. The
method of doing that has already been designed into Blue Mountain’s
“The New Ostrich Industry” concepts and is already being achieved in
some parts of the world by a few producers and processors—and they are
only beginning to see the initial results from this wonderful
production bird. It takes a few years after implementation of such a
program to achieve consistent results, but until this “production”
approach is implemented, the difficulties highlighted in this article
can never be properly addressed and corrected and will always be a
contributing factor to an Ostrich industry that is not viable for
anyone to produce or process the bird. Working together and
implementing the information already known in the parameters of Blue
Mountain’s “New Ostrich Industry” for “production” birds will turn
these non-viable problems and difficulties into viable production
profits for everyone.
Copyright© of Blue Mountain all rights reserved