Blue Mountain
Cutting the Costs of Ostrich Production
Fiona Benson – Blue Mountain International
Daryl Holle, Blue Mountain Feeds Inc.,
First Presented at "The International Conference on Development of Ostrich Estate 2004"
Xi'an, Shaanxi Province, China - March, 2004
Introduction
All businesses are looking for ways to reduce their costs of Production, none more so than farmers. Over the past decade or so, there has been a significant increase in agricultural products (grains, fruit and livestock) raised on contract for the processing company and world supermarkets. This has many advantages in helping to cut costs.
One important element of this move is that the producer, processor and marketers work as a partnership. This paper will demonstrate how producers and processors working in partnership is an essential component to “Cutting the Costs of Ostrich Production” and at the same time improving the overall quality of birds produced.
The factors discussed in this paper are the basics of modern livestock production but all too often overlooked by the developing ostrich industry. Those who study every detail of this paper will recognise the many areas available not only for “Cutting Costs” but also for “Increasing Revenue” very significantly which will allow one to realise the significant and untapped profit potential of Ostrich.
The Value Pyramid
Most are very familiar with the Value Pyramid (Figure 1). Some South African producers have used the Value Pyramid to illustrate why Ostrich production should never become a mass livestock production industry but rather remain focused on skins as the primary product. South Africa believed that a high value for skins was essential to the economic viability of Ostrich.
Today, there are many who have invested in Ostrich Production and the industry continues to grow. While volume is low, the industry will be selling to ‘niche’ markets. To service ‘Niche’ Markets requires top quality products. As volume increases, efficiency improves, prices come down and profits increase – the long run marginal cost vs the long run marginal revenue principal.
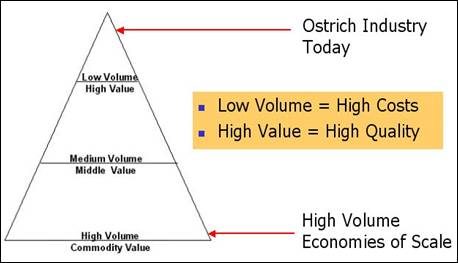
Figure 1 - Value Pyramid
At this time, volume of Ostrich production is very low. To put that statement into perspective, our current world production is around 500,000 slaughter birds representing around 12,500 tonnes of meat. That production is also fragmented throughout many countries and even within each country. There is little or no coordination of effort but rather fighting each other on price has been the order of the day. This has to change if the industry is to mature.
An important part of the process of cutting the costs of production is also looking at optimising the revenue from the whole bird, as the objective is to produce a bird that is profitable to the producer, the processor and the marketer.
We would suggest that so long as our product is high quality, matched by good marketing, the demand vs. supply principle would determine price. It will continue to be a challenge to achieve a price that covers the costs of production if our product is poor quality with an unreliable supply chain caused by such things as:
- Egg production not as expected
- High level of chick mortalities
- Farmers not delivering birds for slaughter when scheduled
- Variations in meat yields [1]
We require 20 million birds, at today’s average level of production, to achieve just 1% of the world beef supplies. It is worth noting that the same volume of meat can be achieved with 12.5 million birds demonstrating increased meat yields per bird at a level that have been proven very achievable [2].
The costs of processing a bird are virtually the same regardless of the meat yield per slaughter bird. By producing a bird yielding 60% and greater meat yields compared to today’s average, the processing costs are slashed and revenue per bird increased (Figure 2). The impact of increasing meat yield on the commercial viability of the bird is very significant.
Processing Costs Meat Yield
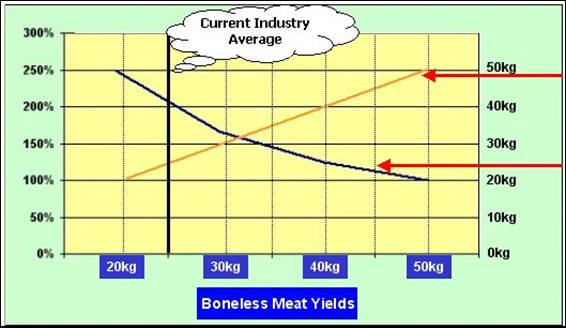
Figure 2 - Impact of Meat Yield in Reducing Processing Costs
This paper will discuss how to value the different critical measurements of performance and the factors that influence these measurements:
- Cost Per Chick (including Incubation)
- Cost Per Kilo Meat Produced
- Cost Per Kilo Meat Processed
- Influence of Carcass Grade on bird revenue
- Influence of Skin Grade on bird revenue
- Influence of Fat Grade on bird revenue
- Influence of Feather Grade on bird revenue
- Influences of Feed Conversion Rates
- Influences of Kill Out Percentages
The Ostrich, when produced correctly, is a most efficient converter of feed to meat and has the potential to be extremely profitable livestock production specie.
Production Inputs
To evaluate cutting costs of production first requires identifying the many input costs. Costs vary significantly from country to country and where one is located within a country. The size of operation will also influence costs. For this reason, it is only possible to discuss general principles and working with current average costs and revenue when values are discussed.
Table 1 - Production Inputs
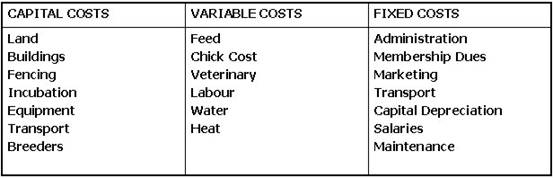
Table 1 lists the main input costs. Capital costs and costs of that capital are included as this is an important element when discussing the impact of both increased chick production per breeder and Slaughter Age on costs of production. Figure 3 summarises these costs. While the actual percentages will be variable from farm to farm, I think all will agree that in principle the proportions are close to accurate. The cost of feed is a very large percentage of all production costs as it is in all livestock production.
The Feed has the most influential part to play on overall profitability and success.
Feed controls:
· Basic Health
· Production & Reproduction
· End Product Quality
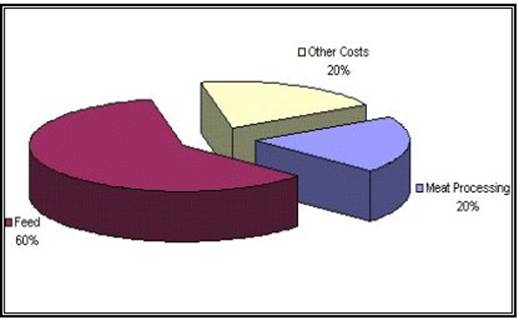
Figure 3 - Summary Production Inputs
Over the past couple of decades, there have been tremendous gains in livestock nutritional technology to enable commercial producers to remain ahead of the cost price squeeze.
Production livestock are production units. The correct way to look at the feed is that it is an investment. Therefore, the producer has to calculate the return on that investment determined by production potential of the nutritional program. This will be governed by the design of the rations, which includes the nutrient density. By nutrient density we are not talking different energy levels, different protein levels or any one specific nutrient having a magical impact, but rather Inclusion levels and quality of all Ingredients, Supplemented Vitamins, Minerals and Amino Acids. [3].
As all rations are certainly not the same in their production potential, a good way to look at rations is to learn how to judge if they are:
v High Production Potential – High Nutrient Density with quality ingredients and high levels of supplemented vitamins, minerals.
v Medium Production Potential – Medium Nutrient Density with quality ingredients and medium to low levels of supplemented vitamins and minerals.
v Low Production Potential – Low Nutrient Density with low-grade ingredients and low levels of supplemented vitamins and minerals. A nutritional program that includes Grazing, Feeding Silage, Green Feed or vegetables of any type either entirely or supplemented will usually fall into this category [3].
Accurately assessing the productive value of the nutritional program is critical to costing livestock production. Producers of other specie are now able to quantify the return on investment of a specific nutrient. This is because they already have a great deal of performance data using High Production Rations. One such example is Figure 4.
Figure 4 is a study carried out for the return on investment when the B Vitamins are included in rations for Pig production. For every additional US$1 spent on B vitamins the producer achieved an additional US$23 in revenue as a direct result of the improvements in performance. There are many similar studies carried out with other specie demonstrating similar and greater returns on investment when vitamin levels are increased in a strategic manner and matched with proper levels and ratios to other nutrients creating production rations.
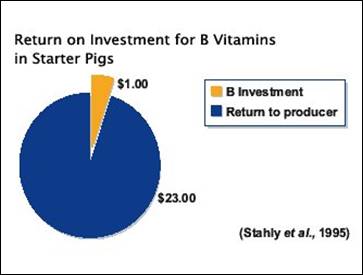
Figure 4 - Return on Investment for B Vitamins in Starter Pigs
Currently vitamin supplementation in most Ostrich rations is extremely low. Vitamins are expensive and that is one of the reasons that High Production rations carry a higher cost per tonne. However, High Production rations can yield significantly greater returns to the producer when done correctly.
Costing Breeder Production – Cost of Chick
The correct method to cost Breeder production is by the number of Slaughter birds produced per breeder rather than the number of eggs and/or number of day old chicks produced by the breeder bird.
Why is this?
· Eggs must be fertile or they are of no value
· Eggs must produce viable chicks
· Chicks must be strong at hatch to:
Ø Resist Disease
Ø Have a Strong Frame for Fast Growth
Ø Efficient Feed Conversion from Day One
Ø Optimise Genetic Growth Potential
There are currently very significant variations in egg production as well as day old chick production. Recent data published [4] confirms this tremendous variation. Brand et al [5] reported a range of 38.1 eggs/hen at 54.9% hatch rate to an average of 55.2 eggs/hen at 57.2% hatch rate. The paper was discussing comparative trials of 3 rations, all low nutrient density, low production rations. The best performance was with the rations with the highest level of nutrients of the 3 rations used in the particular study. It is therefore very reasonable to conclude that on diets that are significantly more nutrient dense than in these trials, the egg averages and hatching rates will be significantly improved. (Figure 5)
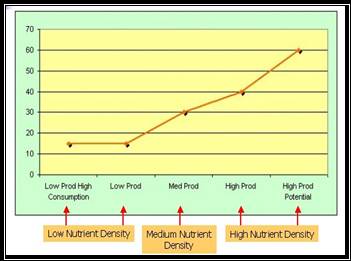
Figure 5 – Chick Production per Hen
What is the impact on production costs?
Figure 6 assumes:
- All production is from Trios of one male and two hens.
- Feed consumption of 800kgs/bird per annum - except “low production high consumption” group that assumes increased daily consumption to 2.5kgs/bird per annum. It is usual that low nutrient density rations are consumed at a higher feeding rate per day.
- High Production is the level of production that is reasonable to expect after a couple of years on high nutrient dense rations, but not raised on nutrient dense rations. It takes time to build back lost reserves [6,7].
- High Production Potential is very possible once the next generation of breeders are raised on High Production Rations. These breeders will be from parents on High Production Rations [6,7].
- High Production Feed Cost average of feed costs of BM in different countries (2003 average costs).
- Medium Production Feed Cost and Performance 75% of High Production
- Low Production Feed Cost and Performance 50% of High Production
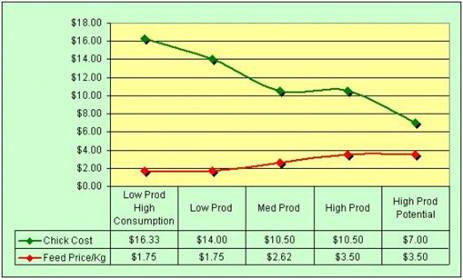
Figure 6 - Breeder Feed Cost per Chick
Figure 6 demonstrates how the costs per chick can be more than halved even though the cost per kilo of breeder feed is doubled. This is the impact of Ostrich’s low daily intake of feed and their high production potential when the nutritional base of the feed in done in a “production livestock” manner.
Incubation Costs
Increasing fertility and hatchability clearly has an impact on the costs of incubation. It costs the same to run the incubator, whether or not all the eggs hatch:
- Capital Cost and Servicing of Capital
- Labour
- Electricity
- Administration
- Misc. Costs
The poorer the eggs, the greater the labour requirements for handling, assisted hatching, etc.
High levels of chick mortality are currently referenced as a high cost to the producer. High chick mortality will have an impact on Incubation costs when slaughter birds, rather than hatched chicks, are used to evaluate the incubation costs per chick.
Use of Correct Rations for Production Group
Many producers have been specialising in raising day old chicks to 13 weeks (3 months). I have personally visited such farms in South Africa where there is a practice of feeding finisher rations to chicks from 8 weeks old. This is a time of rapid growth of the chicks with the opportunity to optimise feed conversion. These finisher rations carry a significantly lower cost per tonne, compared to grower rations, and are designed for older birds more than 40 weeks of age. Finisher rations are very low nutrient density, low production rations.
These chicks move back to the owner or to a buyer for finishing to slaughter. These owners and buyers have been complaining that the chicks do not put on weight once moved to the feed lots and all too often go backwards. It is unlikely that they are aware that the rearers have ‘cut their costs’ by using incorrect feed formulas (finisher rather than grower formulas) and put at risk the future production potential of those chicks to be finished in a reasonable time span.
In addition, when ostrich chicks are moved at 3 to 5 months, there is evidence that they may suffer a decrease in feed consumption that will have very negative affects on feed conversion. This feed conversion failure of course is aggravated when the chicks have been fed formulas of very low nutrient density at such a young age, as is the practice on these farms. This is an example of the need for all in the production chain to be working as a team. The Chick Rearer had cut his production costs, but everyone else following in the chain now have chicks that will be compromised.
Genetics
The right Genetics are critical in any livestock program as a key area to cut the Costs of Production. Over the past decade or so, birds have been sold to many countries. There have been little or no records kept and there are significant differences in the different breeds. In addition, there is a great deal of evidence of stunted growth due to the poor feeding programs and management programs.
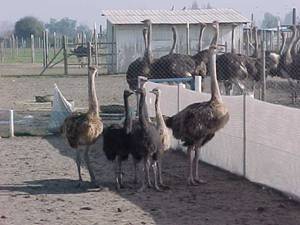
Figure 7 - 12 Week Old Chicks
The chicks in Figure 7 all hatched on the same day. The parents have been on high production rations and the chicks have been on High Production rations. The result is that the underlying genetic potential can now be seen more clearly. There is significant difference in the growth of these chicks. The largest will be a great deal more cost effective to rear and the type of genetics to encourage.
With good records, it will be possible to identify if the different growth rates seen in this batch are consistently the same with chicks from the same breeders throughout the season or if the slower growth rate is a management problem with this particular batch. If a genetic problem, the records will show that certain breeders consistently produce average, above average or below average progeny. As soon as breeders producing these poor growing chicks are identified, it makes sense to cull them from the breeder herd, regardless of the number of eggs and chicks they produce. The poor producing chicks are not economic to raise or process.
The inherent production potential cannot be evaluated in stock that is malnourished. This principle is well proven in livestock production. The end of season chick syndrome, that is currently prevalent throughout the industry, is acknowledged as resulting in weaker chicks. This is a clear symptom of breeders becoming depleted in nutrients and this will influence their inherent production potential.
Overcoming the end of season chick syndrome will not only help to identify the strong genetic breeders, but also result in improved feed conversion and growth rates throughout the season. High Production rations and management systems overcome the end of season chick syndrome.
Other Costs
Improved production per breeder requires less:
v Capital Investment:
Ø Breeders
Ø Land
Ø Fencing
Ø Incubation Facilities
Ø Other infrastructure
v Capital Depreciation
v Veterinary
v Labour
Costing Breeder Production Summary
Though production rations usually carry a higher price per tonne, the improved bird performance brings about significant reductions in the overall breeder and incubation costs in the production of a slaughter bird.
Costing Slaughter Birds
The most important factors when establishing the production costs of slaughter birds are:
- Overall Cost per Kilo of Weight Gain
- Overall Cost per Kilo of Fat production (if servicing an Oil Market)
At the same time remembering:
- Marketability and Revenue potential of Meat
- Marketability and Revenue potential of Fat
- Marketability and Revenue potential of Skins
- Marketability and Revenue potential of Feathers
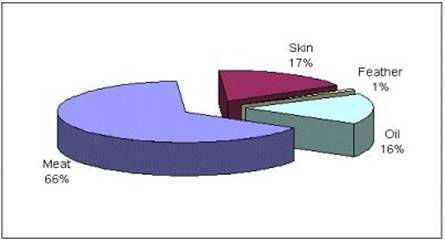
Figure 8 - Approximate Revenue Percentage per Product
Figure 8 is an indication of the percentage of revenue per product. The actual breakdown will vary dependent on local costs, size of operation and markets serviced. They will also vary on whether valuing the different products at producer price or valuing the products at market prices after processing and value adding.
In order for the industry to be sustainable and viable, it is important and most essential to maximise the revenue from the whole bird. However, the meat market is the most important product to establish as the major revenue earner of a slaughter bird as shown in Figure 8. High production nutrition techniques are required for accessing the high quality meat market successfully. The overall health of the birds automatically improves with high production nutrition and that will bring about greater consistency and greater marketability in all the other products.
Slaughter Age
Other livestock meat production species have already proven that the earlier the slaughter age, the greater the profit potential of that slaughter animal. This principle is also true with Ostrich production. Early slaughter age allows for some significant savings and extra benefits:
- Reduction in total Feed Intake
- Reduction in Infrastructure required
Ø Less Land
Ø Less Fencing
Ø Reduced Capital Required
Ø Reduced Capital Servicing
- Reduction in Working Capital
- Reduction in Labour
- Faster return on Working Capital
Yes, we can slaughter Ostrich at a very much younger age and still have skins that are highly acceptable when the birds are raised on High Production, nutrient dense, rations. [8]
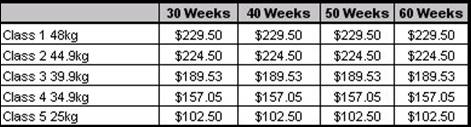
Table 2 demonstrates that when meat payment is on yield basis [9], it is the yield that makes the difference in revenue. Bird age is not directly relevant. However, it is unreasonable to expect Class 1 or Class 2 birds in 30 weeks over the first few years until the quality nutritional build-up and genetic potentials come to reality. Note this is MEAT revenue only, which will vary according to costs in different regions and markets serviced. The important fact is that it is yield that influences revenue irrespective of bird age.
Table 2 - MEAT Revenue per Bird
The Costs to produce the above Revenue can be affected by age. Table 3 demonstrates how much lower the costs are at a younger slaughter age. This is a key area to reduce the costs of production.
Table 3 - Bird Production Costs
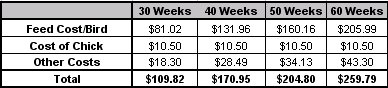
Yield influences Revenue
Slaughter Age influences Costs
Production Costs per kilo of meat produced
Based on the above costs, Figures 9 and 10 illustrate the costs per kilo of meat produced. They clearly demonstrate how the costs per kilo of meat produced are significantly reduced when high production rations are used that enable early slaughter and greater meat yields. This is the mechanism other livestock specie have adopted to reduce their costs of production.
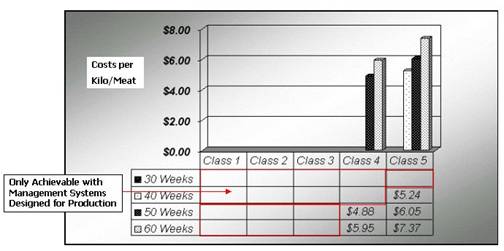
Figure 9 - Costs per Kilo of Meat - Low Production
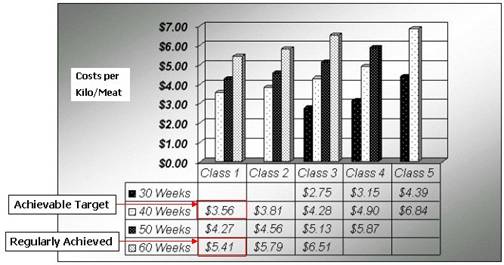
Figure 10 - Costs per Kilo of Meat - High Production
The production costs used in Figure 9 and 10 are the production costs shown in Table 3 with the feed costs in Figure 9 discounted by 40%. Very few birds produced on low production rations that have achieved Yield Class 5 in 40 weeks.
Figure 10 shows the costs per kilo of meat as lower for most all classes and age groups. Class 1 and Class 2 birds in 30 Weeks are not likely to be possible until we are working with the next generations of progeny. Then only if the breeders are on high production rations matched by high standards of feed management and farm management and there has been a sound genetic selection program in place.
After a couple of years implementing the development program and producing Class 1 and Class 2 birds in 40 weeks, the industry will find that these targets are very achievable. The best producers today are achieving Class 1 birds in 60 weeks. That time will shorten as the industry progresses if strategic things are done correctly in nutrition, feeding management and farm management.
Depending on local circumstances, 40 weeks is the optimum age for slaughter at this time in terms of optimising yield and maintaining reasonable production costs per kilo of meat. In this discussion, it is worth noting the following:
- All rearing costs have been included.
- Additional Revenue can also be recovered from the sale of Offal, Skins, Fat and Feathers.
- Figure 2 demonstrates the higher yielding birds carry a reduced processing cost per kilo of meat. The Yield Class payment system [9] enables these savings to be passed onto the producer through a higher “per kilo” payment for the meat. The additional costs of processing a low yielding bird should be charged back to the producer by paying a lower price per kilo of meat.
Processing Costs
The costs of processing are almost the same for a bird whether it is carrying 25kgs of meat or 50kgs of meat.
Processing costs are influenced by:
- Local labour costs
- Building Costs (Rental and/or Cost of capital)
- Efficiency
- Packaging etc.
- Other costs, mostly influenced by the local costs
- Volume
- Market being serviced.
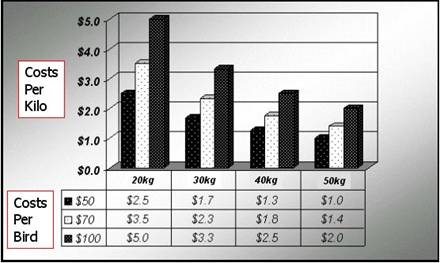
Figure 11 - Processing Costs per Kilo
Currently, processing costs vary considerably from region to region and country to country. Remembering the principle that it costs nearly the same to slaughter a bird regardless of the meat on that bird, Figure 11 illustrates the significant savings in processing costs on a bird carrying a greater meat yield.
Factors Influencing Revenue
The processor working with fair payment systems is rewarded with a better quality bird that is cheaper to process and provides increased revenue for all.
Ostrich Meat:
Yield - A producer and processor working in partnership become a key factor to success if both have a clear understanding of the mutual benefits of operating such a bird payment incentive system. Increasing the meat yield will increase the total revenue per bird for the producer and the processor while reducing the bird processing costs at the same time.
Muscle size - Processors report lost additional revenue opportunities when birds are presented with certain muscles too small to be suitable for their customer’s requirements. This is discussed in more detail in “Understanding Difficulties of Economic Ostrich Processing” [1]
Grade – Currently the industry sells meat as “Ostrich meat”, all being of equal quality. Of course Ostrich are the same as all meat production animals and meat quality is affected by the same influences. The meat from older birds will not be the same as meat from younger birds. Inputs and management influence quality of meat, including taste, aroma, colour, texture etc. The higher the grade, the higher the price, but with a sustainable market not yet established, and very little Prime Grade [10] meat yet on the market, the price differential has not yet been established. It is reasonable to suggest that Prime birds produced in a sustainable supply should be able to achieve prices 25% above the current prices.
We would suggest a premium of 25% is a reasonable estimate at this time given the fact that the market was prepared to pay even greater than that when they first had Ostrich available to them and before they experienced the supply difficulties the industry has been experiencing. In many markets, it is the differential currently achieved between Prime Beef and Choice Grade Beef.
Figure 12 is an illustration of the impact of investment in Vitamin E in Beef Production, both to the feedlot and to the retailer. Vitamin E Beef is an illustration of one type of ‘premium’ meat product.
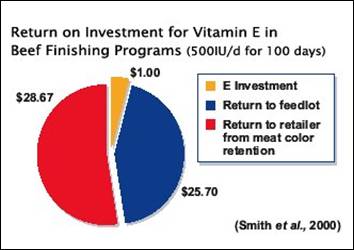
Figure 12 - Financial Influence of Vitamin E Beef
Ostrich Skins:
Handling:
There are obviously significant differences in small producers selling green skins to dealers, and the high costs of this distribution chain, as opposed to slaughter plants with a tannery alongside as is the situation in South Africa. In the former situation the buyers have to visit, look through the skins, skins have to be shipped to central collection points for onward shipping to a tannery. These smaller producers are currently producing 5 skins a week, 50 skins a month, 200 skins a month and similar small quantities. It takes 1200 – 1500 skins to fill a container for volume shipments. A dedicated Ostrich slaughter plant will be producing several hundred skins per day or per week.
Clearly, the handling costs are significantly higher for the low volume producers than these slaughter plants with their tannery within reasonable distance and producing several hundred skins a week. In addition, these buyers from the small producers cannot pay on finished skin grade as feedback from tannery is rarely possible. The net result is that prices are set at average skin quality instead of the ability to reward the producer making an effort and penalise the poor skins more heavily.
Deskining and Storage:
There have been many skins ruined and rendered valueless through poor handling at the slaughter plant and/or poor storage. Care in these areas can add value to a bird.
Handling and Tanning:
The costs to handle, transport and tan a skin are the same regardless of the end value of the skin. Therefore, the lower the grade the less money there is available to pass back to a producer.
Grade:
Selling Green in low volume:
- Any skin reasonably free of defects – 100% of current price
- Any skin with a major defect, but some usable skin – 50% of current price
- Reject – no value
A good supplier selling to this market will achieve on average 90% Grade A and 10% Grade B. A poor supplier can have 80% rejects. The difference in revenue per bird will depend on current skin prices. A fair estimate of that difference, at today’s prices could be in the region of US$45/bird when skins are sold in low volume.
Selling by Finished Grades – Value depends on
the market being serviced.
Listed below are the percentage differences generally used to set the payment
differentials between grades of finished skins.
Grade 1 – 100%
Grade 2 – 80% of Grade 1
Grade 3 – 60% of Grade 1
Grade 4 – 40% of Grade 1
Grade 5 – 25% of Grade 1
Reject – No Value
It is worth noting that producers selling direct to the tannery, as is the case in South Africa, will also be paid on finished grades. This provides a fairer payment system to producers and encourages improved quality.
Skins below the minimum size of 14 sq. foot are discounted. Birds producing small skins will usually be yielding less than 20kgs of meat and are not economic to produce or process.
Skins with immature and/or very small follicles are discounted by approx. 20% depending on market serviced.
Early slaughter reduces the risks of scaring to the skins and has been proven to yield a higher percentage of high grades. [11]
Average grades achieved vary significantly from farmer to farmer. South African producers also report variations in average grades achieved depending on the slaughter plant takes the birds. Different tanneries service different end markets that carry different grading standards.
The difference in revenue per bird when payment is based on finished grade can be in excess of $100/bird to the producer at today’s prices. That represents a very large proportion of the feed costs and in some cases, the total feed costs, depending on location and local ingredient prices.
The variation in range in the two systems is a direct reflection of the increased handling costs of handling skins in low volume and the inability to reward on finished grade achieved.
Ostrich Fat:
A number of producers make use of the fat. The only meaningful data available on fat conversion rates comes from the Emu industry. The principles are the same. The processors report as much as 35% variations in oil yield from the same weight of fat. The high production feed formula produces a white fat that yields well. The lower the nutrient density of the feed, the poorer the fat quality and the lower the fat yield.
Assuming oil with a sale value of US$15/litre, that 35% variation in yield on an average bird yielding 8kgs Fat would represent:
Range of US$ 16/bird net revenue from worst to best
Range of US$ 21/bird processing costs from worst to best
Range of US$ 37/bird Gross Revenue
Ostrich Feathers:
Breeder Birds:
Many harvest the feathers from the breeder birds. The industry was originally based on this lucrative market. Feathers were also the revenue from the birds.
Post 2nd World War a steady market developed with revenue from the skins, but the feathers were still worth millions of South African Rands in gross revenue.
It will be necessary to balance the value of the feather harvest against the potential value of lost production from the breeders as the industry increases in size and becomes increasingly commercial. The stress of handling the birds at the end of a hard breeding season and the potential loss of birds during the process will be contributing factors that will influence production in the future breeding season, therefore having an impact on costs of production.
Slaughter birds
The revenue from feathers is low by comparison to the revenue from other products. The best slaughter birds can achieve around US$20/bird and the worst around US$1.00/bird. It requires reasonable volumes before the feathers can be of any value as the feathers are labour intensive to handle.
The late slaughter age (12 – 14 months) has resulted in some South African producers plucking slaughter birds at 7 months and therefore achieving two feather crops from their slaughter birds. The revenue achieved helped cover the feed costs to maintain the birds until a later slaughter date. Handling birds at this age will affect feed conversion and it is doubtful that the value achieved for the feathers is worth the labour involved, the lost meat production or risk of damage to the skins during the handling process with younger slaughter ages being achieved.
Factors that Influence Production
Nutrition, Feed Management, Farm Management and Genetics all work together and in that order to influence Feed Conversion, Kill Out percentage and Meat Yield.
The principles of all the factors are a large subject on their own and well covered in our books and bulletins. This discussion will be limited to how these aspects all connect together and the impact on production costs and revenue per bird.
Nutrition:
Production Livestock Nutrition today is very precise. Because of the Ostrich’s small daily intake of feed, a small error in mixing or weighing will have an impact on performance and revenue even when the rations are formulated correctly.
My own personal experiences include my own Ostrich farm in South Africa, working actively in Spain, having previously farmed in England and Wales (Dairy) and working with other producers in many countries. This experience has clearly illustrated to me just how standards vary from country to country with quality standards and availability of feed ingredients as well as feed manufacturing standards. That led to placing such emphasis on the ingredients as well as the manufacture at the top of the Quality Control Chain, Production Chain and Value Chain of Ostrich production (Figure 13) [12]. An error in any one of those aspects of the feed will negatively affect the profitability of every single member of the chain.
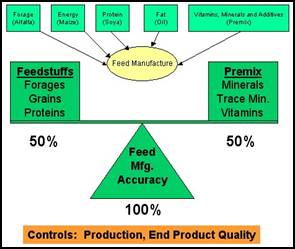
Figure 13 - Feed Accuracy
Accuracy of lab analysis of ingredients is critical. Taking Lucerne/Alfalfa as one example, but very important example, let me share a personal experience to illustrate the importance of lab analysis.
Table 4 - Lucerne Comparisons
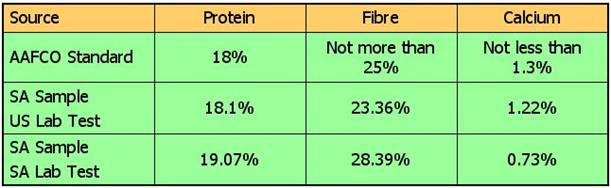
Table 5 has 3 comparative analyses:
AAFCO Standard: This is the standard for 18% Lucerne as described by the US Feed Standards AAFCO.
A previous batch of Lucerne on my own farm sampled with a calcium content of 0.80%. The analysis was carried out by Elsenberg College, Stellenbosch, South Africa. Elsenberg performs an ingredient testing service for producers. Somewhat surprised at such a low calcium reading, I asked advise from the Lucerne experts at the college. I was informed that these low calcium levels were usual for South Africa. Pure Lucerne inherently has minimum levels of calcium very much higher than these levels reported in the analysis. The answer that these low levels were usual for South Africa justified further investigation.
Samples were then taken from the next delivery and split. One half went to Elsenberg College and the other half to a laboratory in the United States. The differences in the two test results, as can be seen in Table 5, are very different. This example illustrates the importance of accuracy in sampling and how they can vary. To formulate to these different results from the same sample would result in very different rations with very different performance levels. Ostrich rations can contain anything from 30% to over 50% Lucerne, depending on the ration, so it is essential that the analysis is accurate.
The effect of Feed Conversion Ratio (FCR) and Improving Liveweight to Boneless Meat Ratio
Any error will have an impact on Feed Conversion and potential meat yield so it is essential to ensure that every aspect of High Production rations, feed management and farm management are correct. Table 6 demonstrates the difference in Feed Conversion on Liveweight at 45 weeks with meat yield at 32% conversion from Liveweight and 35% conversion from Liveweight. Currently the variations reported are as low as 24% and high as 37%.
An important factor to note in this discussion is that feed consumption is the same in all examples, as we are discussing the same age bird.
Optimising Feed Conversion and Percentage of Liveweight to Meat from the same feed consumption (Table 6) has a significant impact on revenue per bird. The combination of Feed, Feed management, Farm management and Genetics, in that order, all have impact on these measurements of performance.
Table 5 - Impact of FCR and Different Liveweight to Meat Yield Conversion Rates
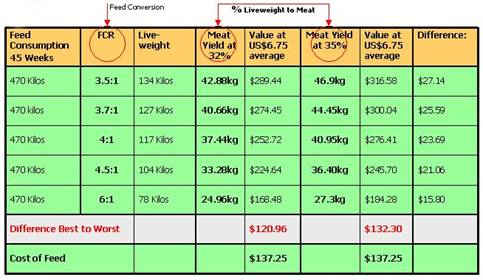
Table 6 demonstrates the revenue difference in the improved performance and that it virtually covers the total costs of feed at that age group from worst t best. Note also that this is meat revenue only. Additional revenue will be generated from Skins, Offal, Fat and Feathers.
Reducing the Cost of Feed
The feed is the highest percentage of all the input costs. As has been demonstrated, the feed controls Health, Production and Product Quality. It is through the right feed that producers ‘reduce the costs of production’ and ‘increase their revenue’.
The correct route to reducing the ‘cost of feed’ is to first identify the Feed with Highest Production Potential, then produce it as cost effectively as possible and watch all other factors that have an influence on the overall cost of that feed:
Reducing Cost per tonne:
- Bulk Purchasing of Ingredients
- Volume - Small groups working together can increase their purchasing power
- Farm Production of Major Ingredients
- Ingredient Quality:
Ø Example: High Protein Lucerne can replace more expensive protein ingredients in rations
- Control Manufacture
- Location – minimise transport costs of the bulk ingredients
Management Factors:
- Minimise Wastage
- Ensure High Standard of Feed Management
- Ensure High Standard of Farm Management
- Improve Genetic Base
After spending a number of years working with producers to help understand how to source ingredients at the best price and the right quality, we have experienced significant variations in standards from country to country. A lesson learnt is that any producer or company wanting to make a success of their ostrich operation has to understand how these standards differ and what is required to assure your operation has the best quality available. This is a subject of it’s own. However, understanding the need is an important part of a discussion on understanding the economics of production and how to cut production costs effectively.
Conclusion
The basics discussed in this paper are fundamental to profitable commercial livestock production management.
The successful groups will recognise that the way to "cut the costs of production" effectively is for all in the chain to begin working together as a team on these details to ensure profitability. All people involved in the chain are interdependent on each other.
[1] F.V. Benson and D.G. Holle - Understanding Difficulties of Economic Ostrich Processing, Eastern Cape Ostrich Producers Association Newsletter, 2001
[2] F.V. Benson and D.G. Holle – Potential Meat Yield of Ostrich, Nutritional Bulletin No. 81, 2002
[3] F.V. Benson and D.G. Holle - Basics of Production Ostrich Nutrition Parts 1 and 2 – Benson and Holle, World Ostrich Congress, Poland 2002.
[4] S.W.P. Cloete, S.J. van Schalkwyk and K.L. Bunter, Progress in Ostrich Breeding Research, World Ostrich Congress Poland, 2002
[5] Z. Brand et al Preliminary results of the effect of dietary energy and protein levels on production of ostrich female breeders.
[6] F.V. Benson and D.G. Holle – The Road Map to the New Ostrich Industry, Nutritional Bulletin No. 92 2003
[7] F.V. Benson and D.G. Holle - Ostrich Genetics and Nutrition, Nutritional Bulletin No. 87 2002
[8] F.V. Benson and D.G. Holle – Influences of Ostrich Skin Quality – Age or Nutrition, Nutritional Bulletin No. 79, 2002
[9] World Ostrich Association Ostrich Meat Yield System – http://www.world-ostrich.org
[10] World Ostrich Association Ostrich Carcass Grading – http://www.world-ostrich.org
[11] Experimental Farm, Oudtshoorn…study on Skin Grading and Age.
[12] F.V. Benson and D.G. Holle – The World Ostrich Industry Today, First Latin American Congress on Conservation and Commercial Breeding of Ñandúes, 2003
Copyright© of Blue Mountain all rights reserved